This tool was developed in the course of a complex fractured rock site investigation involving more than 1,100 monitoring wells and groundwater samples analyzed for numerous chemical constituents. The site presented significant challenges: multiple contaminant plume sources, migration through dipping and variably oriented fracture zones, the presence of a fault zone, and a highly three-dimensional distribution of contaminants.
To make sense of this dataset, I created a custom analytical tool in Microsoft Excel using Visual Basic for Applications (VBA). This tool enabled dynamic, visual, real-time exploration of the full dataset: three spatial dimensions plus chemical fingerprints, concentrations, hydraulic head, and fracture orientation, without the need for specialized 3D modeling software like EVS.
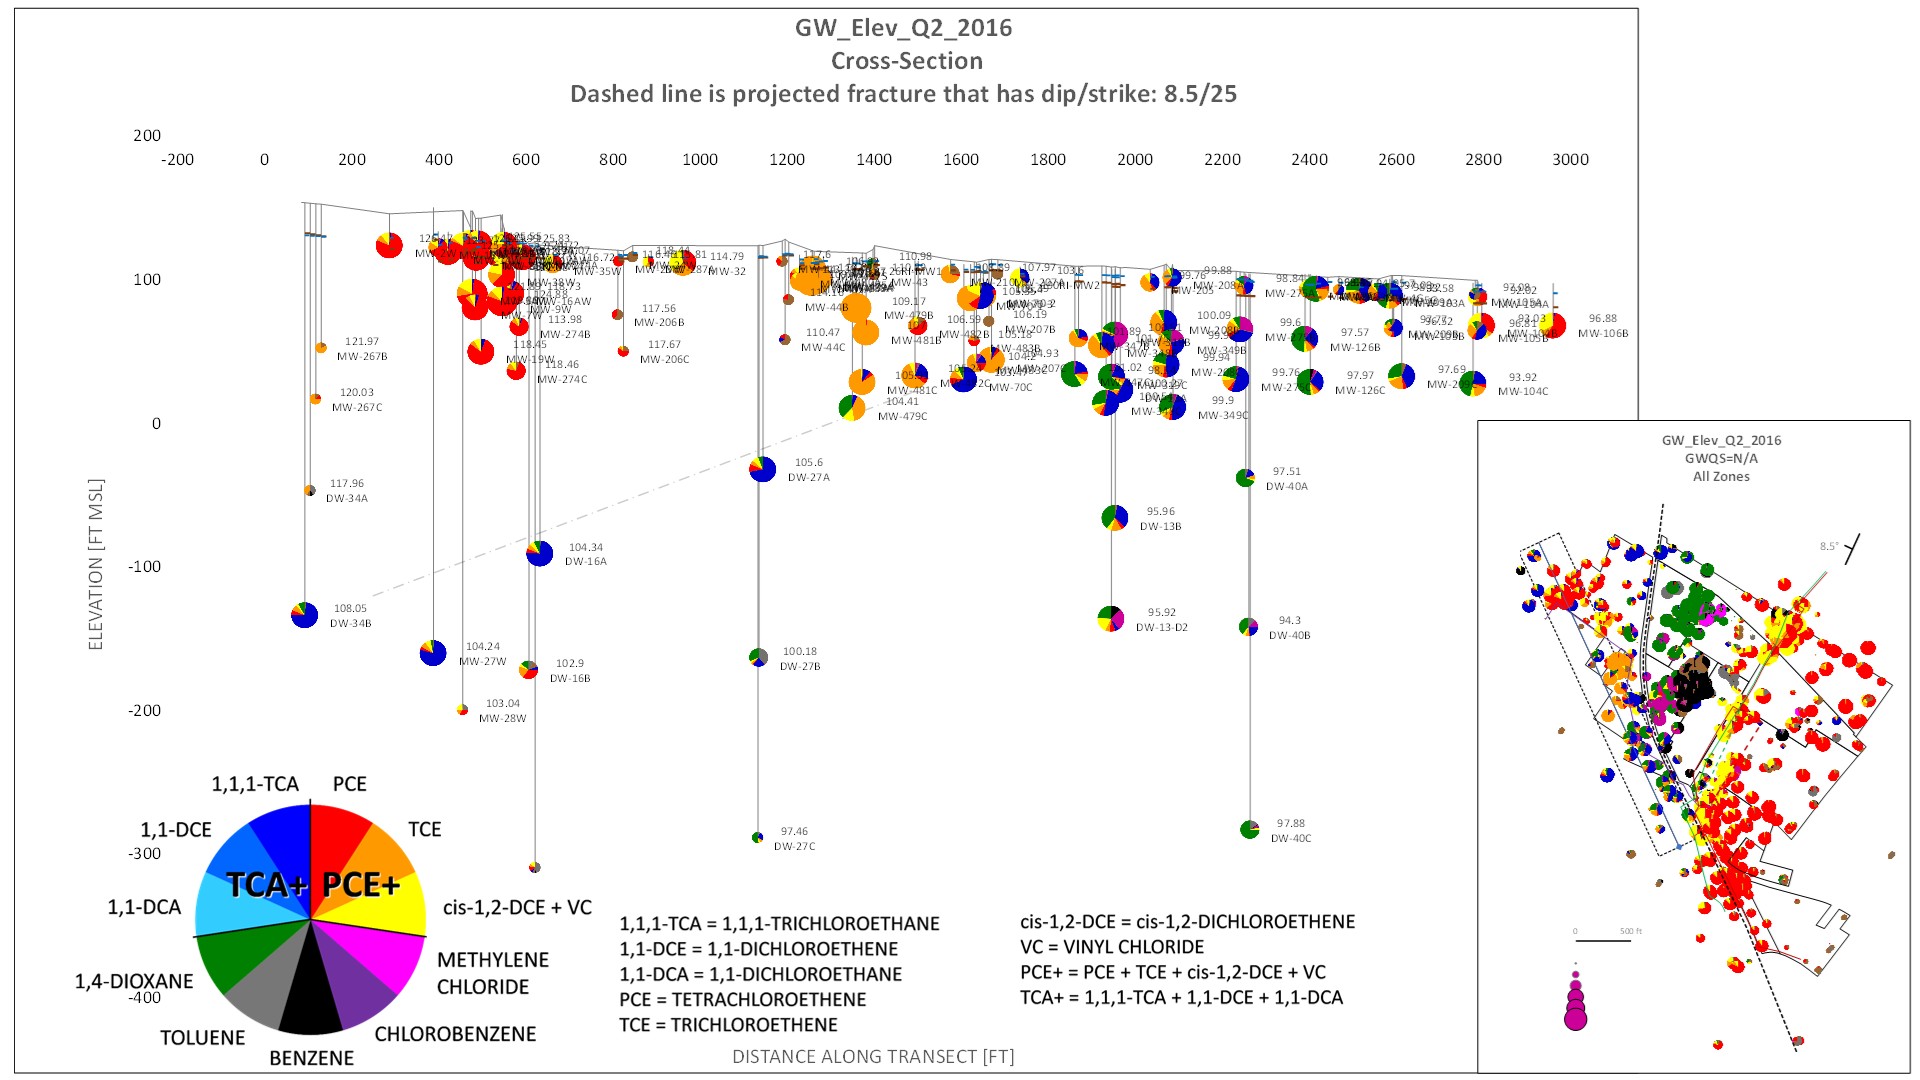
The tool allowed:
- Plan view and cross-sectional visualization of groundwater data at selected elevation intervals and along any desired transect orientation. The dip and strike of the cross section could be adjusted simply by entering new values into the “viewing options” cells, which triggered an immediate update of the maps and cross section visualizations.
- Projected well data using a buffer zone around the cross section, allowing well screen intervals and chemical concentrations to be displayed accurately. The transect orientation and associated buffer zone were also shown on the map view, with all positioning controlled through the viewing options interface.
- Pie chart representation of chemical signatures directly at well screen locations. Chemical constituents could be selectively included in the pie charts by specifying them in the viewing options cells. This enabled visualization of low-concentration compounds that might otherwise be obscured in full-spectrum charts.
- Integration of hydraulic head data and structural features (e.g., bedding plane orientations) to support hydrogeologic interpretation. The cross section displayed both the chemical composition and relative total concentration in each well, along with the measured water level (hydraulic head). These elements were plotted based on parameters set in the viewing options.
- Flexible map-view elevation control, enabling users to define the upper and lower elevation bounds of the displayed plan-view data by entering values into the viewing options cells. This made it easy to isolate specific vertical zones for targeted evaluation.
This configuration enabled independent exploration of relationships between geologic structure, hydraulic conditions, and chemical signatures in real time. It was particularly effective for distinguishing overlapping contaminant plumes and tracing them to discrete sources at different depths and along specific structural features.
Traditional 2D groundwater mapping or GIS and even EVS workflows would not have provided this level of flexibility and resulting ability to gain iterative insight. The tool’s iterative, hands-on nature made it possible to engage directly with the data, allowing for faster and deeper understanding of plume behavior in complex fractured rock environments.