
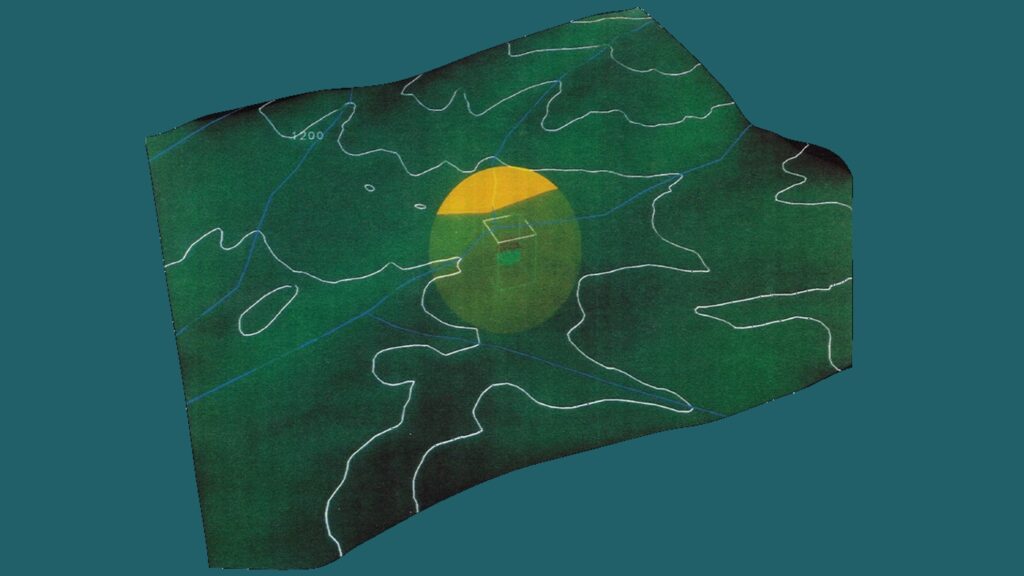
Used Advanced Visual Systems (AVS) software [not to be confused with EVS] to create a 3-D geologic model of a research site in Raymond, California. The model aided interpretation of borehole geophysical logging data. The research site was funded by the U.S. Department of Energy and U.S. Environmental Protection Agency.
When used judiciously, 3D visualization is a powerful tool that can significantly aid the hydrogeologic characterization process at complex sites. For example, boreholes and their associated data can be viewed, and the entire spatial field can be rotated and exaggerated. This enables detection of 3-dimensional geologic structures that would otherwise not be observable on conventional 2-D plots. Visualization software was used for the Raymond Field Site characterization in an iterative manner to further the understanding of the three-dimensional structure of transmissive fractures. One very useful feature of the model was in deducing subsurface fracture connectivity and structure. For example, a transmissive fracture identified by various geophysical logs and borehole imaging tools in one well was represented as a plane and superimposed onto the 3D well field. The points at which this fracture would hypothetically intersect wells were easily seen. Integrating these images with all geophysical logs allowed for easy determination of whether the fracture extended between wells. Performing such hypothesis testing and interpolation routines would be difficult without the use of visualization software, although years later I created a customized 3D visualization tool via VBA programing in Microsoft Excel to examine borehole data in a similar fashion.
Figure: Oblique view of translucent land surface (with topographic elevation contours). Dipping fracture in borehole is extrapolated (yellow disk) to estimate likely outcrop location.